Case Examples
Let’s consider a simple case when our task is to fit one variable to one label. We shall construct the matrix of features and concatenate a vector of ones to it, and write a form for the vector of labels and the vector of weights. For our problem they will look like this
where is the sample size. We find the optimal weights from the expression.
The plot below shows the scatter plot of the data and the line

Notice that the line has about equal amount of data points above and below it. This indicates that the model is successful. Because the line has a positive slope we can conclude that the label and the feature have a positive correlation (as feature increases, the label also increases). The converse is true if the slope of the line is negative.
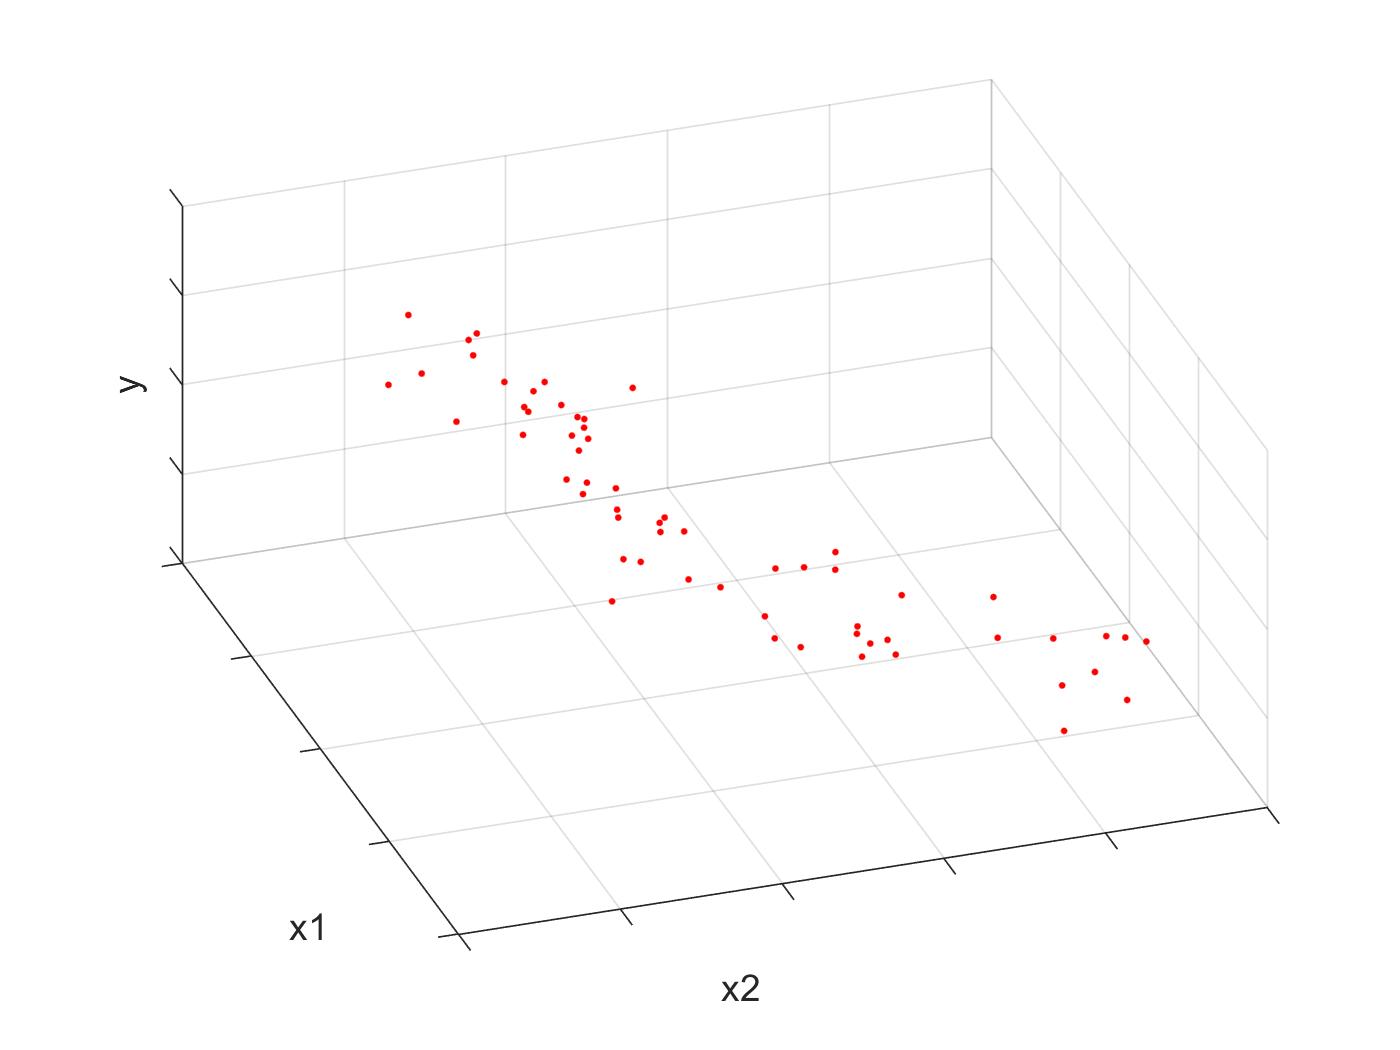
Let’s extend the number of features. We have two features and which describe the label . A scatter plot in 3D for such data is shown below.

Therefore we can construct the matrix X which is defined as
Where we have 3 columns because we have features. The vector of optimal weights is still
This equation will yield a 3-entry column vector .
Therefore our linear surface of best fit is
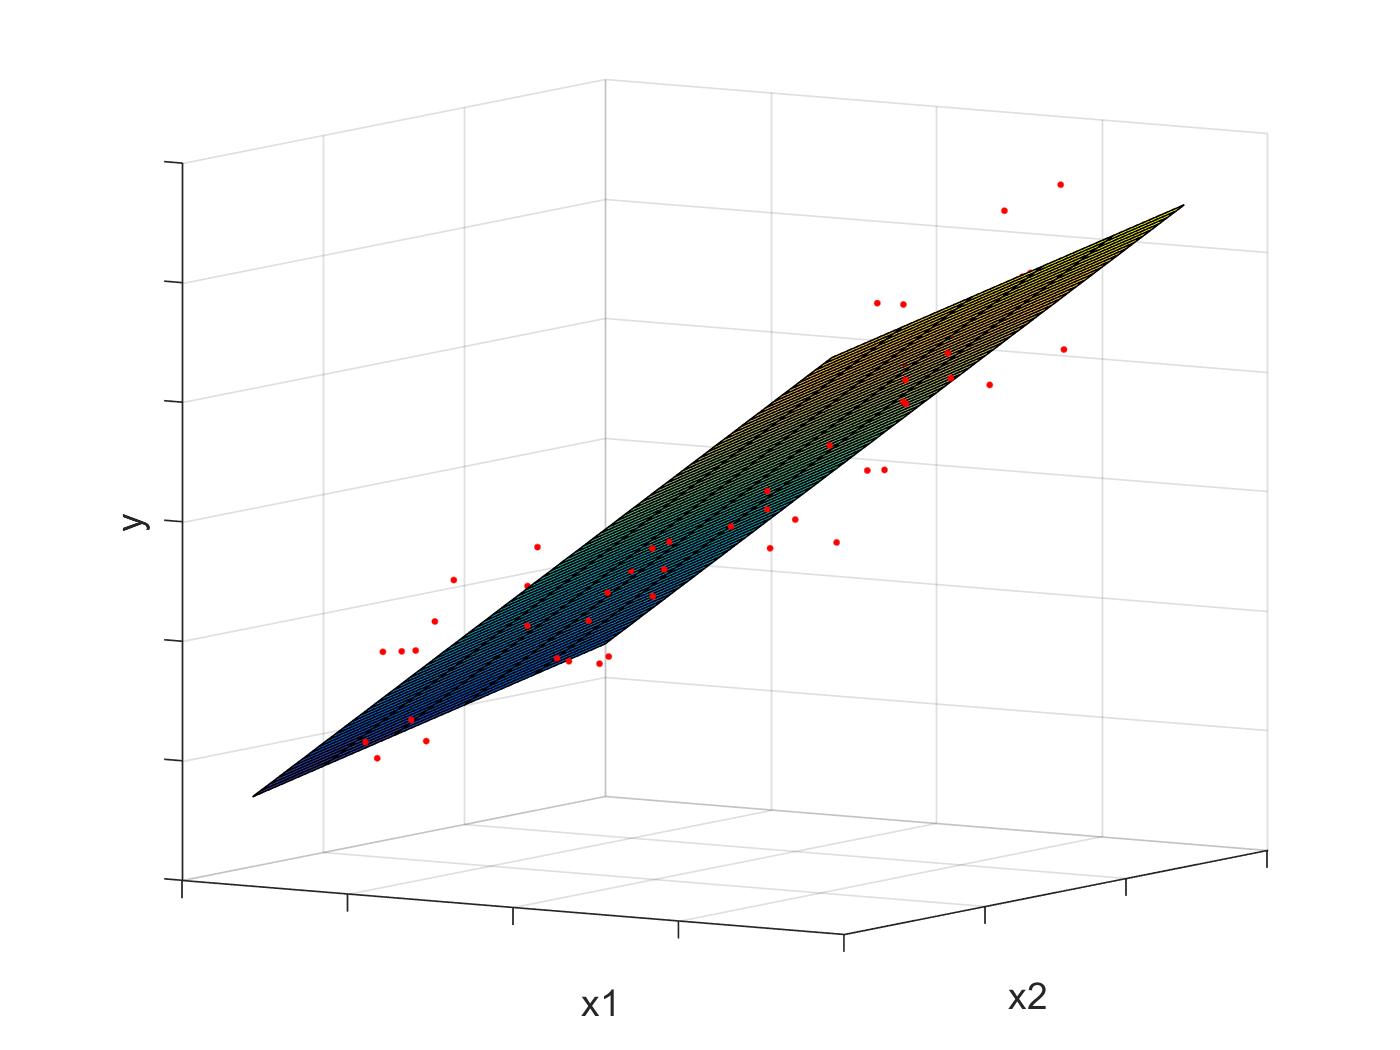
This graph below shows a dataset of two features, and plotted against their true labels . Each point is plotted as a red dot. The best fitting linear surface, given by the weights , , and is plotted over a range of values to show how our model would predict any point along this range.

The following graphs show this same image from different perspectives. Note how the surface lines up with the direction of greatest variance.

